How Data Science Is Changing the Game in Trading
Discover how data science revolutionizes trading through algorithmic strategies, predictive modeling, and risk management. Learn about the tools, techniques, and real-world applications transforming financial markets.
Picture this: while you're sipping your morning coffee, thousands of trading algorithms are already making split-second decisions worth millions of dollars. Welcome to the world of data-driven trading, where numbers tell stories, patterns predict profits, and machines can process market information faster than any human ever could. Gone are the days when successful trading relied solely on gut instincts and market intuition. Today's financial markets are dominated by data scientists who turn raw information into profitable strategies, and the results are nothing short of revolutionary.
The financial industry generates an estimated 2.5 quintillion bytes of data every single day. From stock prices and trading volumes to news articles, social media sentiment, and economic indicators – every piece of information can potentially move markets. Smart traders and investment firms have realized that those who can best harness this data tsunami will have the ultimate competitive advantage. This isn't just about having more information; it's about transforming that information into actionable insights faster and more accurately than the competition.
What Is Data Science and How Is It Used in Trading?
Data science in trading is the art and science of extracting meaningful patterns from financial data to make better investment decisions. Think of it as having a super-powered crystal ball that doesn't rely on magic, but on mathematics, statistics, and computer algorithms. Instead of guessing where a stock price might go, data scientists build models that can analyze historical patterns, current market conditions, and even external factors like news sentiment to make educated predictions about future price movements.
The Three Pillars of Trading Data Science
- **Statistics and Mathematics**: The foundation for understanding market relationships, calculating probabilities, and measuring risk versus reward
- **Programming and Technology**: Tools like Python, R, and specialized trading platforms that can process massive amounts of data in real-time
- **Domain Knowledge**: Understanding how financial markets work, what drives price movements, and how different economic factors interact with each other
In practical terms, data science transforms trading from reactive to predictive. Traditional traders might buy a stock because they read positive news about a company. Data science-driven traders, however, can identify patterns that predict which types of news will move stock prices, how much they'll move, and how long the effect will last. This predictive power extends to everything from individual stock picks to entire portfolio management strategies.

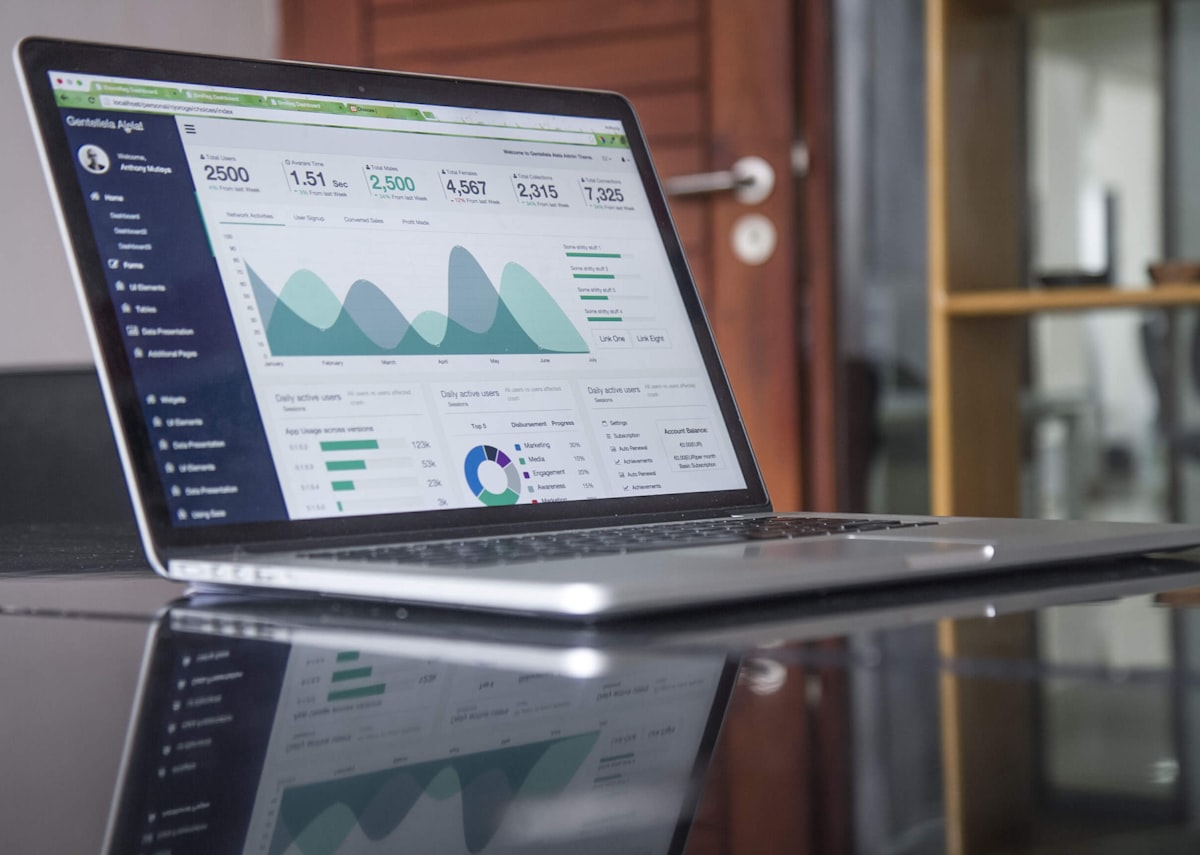
Modern trading floors rely heavily on data science and algorithmic systems for real-time market analysis
Types of Data Used in Trading: From Numbers to News
The beauty of modern trading lies in its ability to incorporate virtually any type of information that might influence market movements. Data scientists classify this information into two main categories: structured data (the neat, organized numbers) and unstructured data (the messy, human-generated content). Both types are crucial for building comprehensive trading strategies that can adapt to our complex, interconnected global economy.
Structured Data: The Foundation of Financial Analysis
- **Price Data**: Open, high, low, close prices and trading volumes for stocks, bonds, commodities, and currencies
- **Financial Statements**: Revenue, profit, debt, and other accounting metrics from company reports
- **Economic Indicators**: GDP growth, inflation rates, unemployment numbers, and central bank decisions
- **Market Microstructure**: Order book data, bid-ask spreads, and transaction-level information
- **Corporate Actions**: Dividends, stock splits, mergers, acquisitions, and earnings announcements
- **Alternative Data**: Satellite imagery, credit card transactions, and supply chain information
Unstructured Data: Reading the Market's Mood
- **News Articles**: Financial journalism, press releases, and regulatory filings
- **Social Media**: Twitter sentiment, Reddit discussions, and LinkedIn professional networks
- **Analyst Reports**: Research notes, price targets, and investment recommendations
- **Conference Calls**: Earnings calls, investor presentations, and management commentary
- **Regulatory Filings**: SEC documents, patent applications, and legal proceedings
- **Audio and Video**: Interviews, podcasts, and financial news broadcasts
| Data Type | Examples | Update Frequency | Analysis Method | Trading Impact |
|---|---|---|---|---|
| Price Data | Stock prices, volumes, forex rates | Real-time | Technical analysis, time series | Direct price movements |
| News Sentiment | Financial news, press releases | Continuous | NLP, sentiment analysis | Short to medium-term volatility |
| Economic Data | GDP, inflation, employment | Monthly/Quarterly | Statistical analysis | Long-term market trends |
| Social Media | Twitter, Reddit, forums | Real-time | Sentiment analysis, NLP | Short-term momentum |
| Corporate Data | Earnings, financials, ratios | Quarterly | Fundamental analysis | Medium to long-term value |
| Alternative Data | Satellite images, credit cards | Variable | Machine learning | Unique insights and alpha |
Key Techniques and Tools in Quantitative Trading
The toolkit of a quantitative trader reads like a computer science textbook mixed with advanced mathematics. But don't let the technical terminology intimidate you – these are simply powerful methods for finding patterns in data and turning those patterns into profitable trading strategies. Let's break down the most important techniques that are reshaping how professionals approach financial markets.
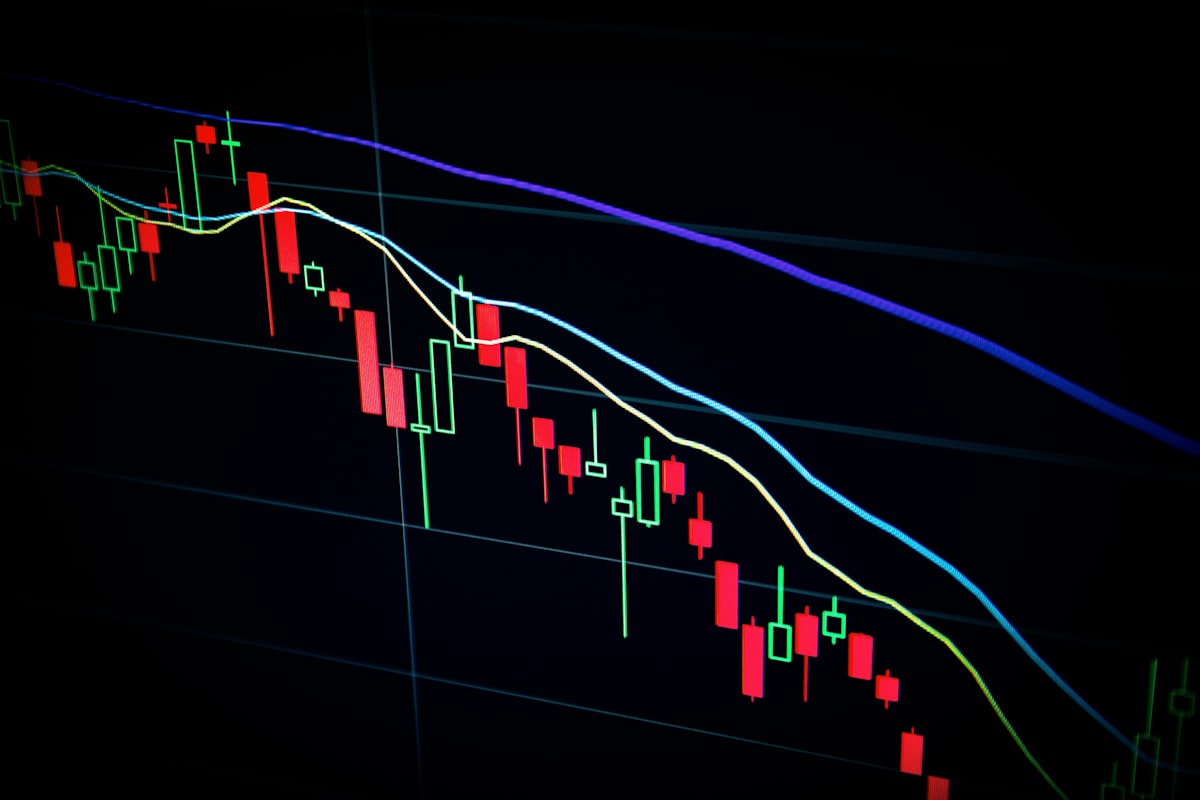
Time Series Analysis: Understanding Market Patterns Over Time
Time series analysis is the bread and butter of financial data science. Since stock prices change over time, understanding temporal patterns is crucial for making predictions. This includes identifying trends (is the stock generally going up or down?), seasonality (does it perform better in certain months?), and cyclical patterns (does it follow economic cycles?). Advanced techniques like ARIMA models, GARCH for volatility modeling, and state-space models help traders forecast future price movements based on historical patterns.
Machine Learning: Teaching Computers to Trade
- **Supervised Learning**: Training models on historical data to predict future prices or classify market conditions
- **Unsupervised Learning**: Finding hidden patterns in market data, such as clustering similar stocks or identifying market regimes
- **Reinforcement Learning**: Teaching algorithms to make trading decisions by rewarding profitable actions
- **Deep Learning**: Using neural networks to process complex, multi-dimensional data like news sentiment combined with price action
- **Ensemble Methods**: Combining multiple models to create more robust and accurate predictions
- **Feature Engineering**: Creating new variables from raw data that help models better understand market dynamics
Natural Language Processing: Reading the Market's Mind
Natural Language Processing (NLP) allows trading systems to "read" and understand human language in news articles, social media posts, and financial reports. This technology can automatically determine whether a news article is positive or negative for a stock, extract key information from earnings calls, or even detect unusual patterns in social media chatter that might predict market movements. Some hedge funds now employ more data scientists than traditional analysts because of NLP's power to process information at superhuman scale and speed.
Essential Tools and Programming Languages
| Category | Tool/Language | Primary Use | Learning Difficulty | Industry Usage |
|---|---|---|---|---|
| Programming | Python | Data analysis, ML, backtesting | Beginner | Very High |
| Programming | R | Statistical analysis, visualization | Intermediate | High |
| Programming | C++ | High-frequency trading systems | Advanced | High |
| Data Analysis | pandas | Data manipulation and analysis | Beginner | Very High |
| Machine Learning | scikit-learn | General ML algorithms | Intermediate | High |
| Visualization | matplotlib/seaborn | Creating charts and graphs | Beginner | High |
| Backtesting | Zipline/Backtrader | Strategy testing and validation | Intermediate | Medium |
| Trading Platform | QuantConnect | Cloud-based algo trading | Intermediate | Medium |
| Database | SQL | Data storage and retrieval | Beginner | Very High |
| Big Data | Apache Spark | Large-scale data processing | Advanced | Medium |
# Simple Moving Average Trading Strategy Example
import pandas as pd
import numpy as np
import matplotlib.pyplot as plt

# Load stock data
data = pd.read_csv('stock_prices.csv')
data['Date'] = pd.to_datetime(data['Date'])
data.set_index('Date', inplace=True)

# Calculate moving averages
data['MA_20'] = data['Close'].rolling(window=20).mean()
data['MA_50'] = data['Close'].rolling(window=50).mean()

# Generate trading signals
data['Signal'] = 0
data['Signal'][data['MA_20'] > data['MA_50']] = 1  # Buy signal
data['Signal'][data['MA_20'] < data['MA_50']] = -1  # Sell signal

# Calculate returns
data['Returns'] = data['Close'].pct_change()
data['Strategy_Returns'] = data['Signal'].shift(1) * data['Returns']

# Performance metrics
total_return = (1 + data['Strategy_Returns']).cumprod().iloc[-1]
sharpe_ratio = data['Strategy_Returns'].mean() / data['Strategy_Returns'].std() * np.sqrt(252)

print(f"Total Return: {total_return:.2%}")
print(f"Sharpe Ratio: {sharpe_ratio:.2f}")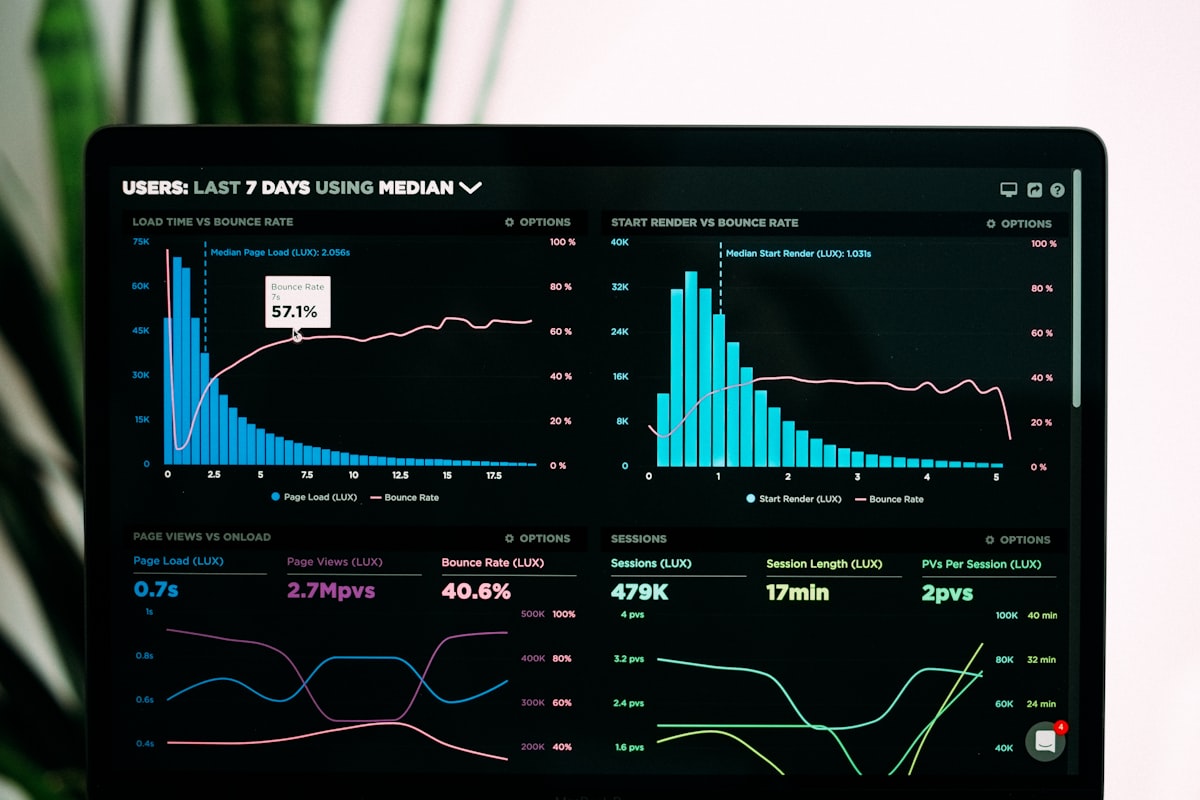
Python and other programming languages are essential tools for modern quantitative trading
Real-World Applications: From Algo Trading to Portfolio Optimization
The rubber meets the road when we examine how data science actually gets applied in real trading scenarios. From Wall Street giants managing billions in assets to individual traders working from home, data science applications span the entire spectrum of financial markets. These aren't just theoretical concepts – they're battle-tested strategies that move real money and generate real profits (and sometimes losses) every trading day.
Algorithmic Trading: When Robots Make the Decisions
Algorithmic trading systems can execute thousands of trades per second, each one based on complex mathematical models that analyze market conditions in real-time. These systems don't get emotional, don't need coffee breaks, and can process far more information than any human trader. High-frequency trading firms use these systems to profit from tiny price differences that exist for milliseconds. Meanwhile, institutional investors use algorithms to break large orders into smaller pieces, minimizing market impact when buying or selling massive positions.
Smart Portfolio Management: Balancing Risk and Reward
Modern portfolio theory gets a major upgrade with data science. Instead of simple diversification rules, algorithms can analyze correlations between thousands of assets, predict how they might perform under different economic scenarios, and automatically rebalance portfolios to maintain optimal risk levels. Robo-advisors like Betterment and Wealthfront use these techniques to manage billions of dollars for retail investors, providing institutional-quality portfolio management at a fraction of traditional costs.
Risk Management: Protecting Capital with Data
- **Value at Risk (VaR) Models**: Calculating the maximum likely loss over a specific time period
- **Stress Testing**: Simulating how portfolios would perform during market crashes or unusual events
- **Real-time Monitoring**: Continuously tracking risk metrics and automatically adjusting positions
- **Correlation Analysis**: Understanding how different investments move together during volatile periods
- **Dynamic Hedging**: Automatically buying or selling protective positions as market conditions change
- **Liquidity Risk Assessment**: Ensuring positions can be closed quickly if needed
Modern risk management systems use real-time data to monitor and protect trading portfolios
The Benefits of Using Data Science in Trading
The advantages of incorporating data science into trading strategies extend far beyond just making more money (though that's certainly a nice benefit). The transformation touches every aspect of how trading decisions are made, executed, and evaluated. Let's explore why virtually every successful modern trading operation has embraced data-driven approaches.
Lightning-Fast Decision Making
While human traders might take minutes or hours to analyze a potential trade, data science algorithms can evaluate the same opportunity in microseconds. This speed advantage isn't just about being first to market – it's about processing vast amounts of information simultaneously. A single algorithm can monitor hundreds of stocks, analyze news from dozens of sources, and execute trades across multiple markets faster than a human could even read a single headline.
- **Objective Decision Making**: Removes emotional bias and psychological factors that often lead to poor trading decisions
- **24/7 Market Monitoring**: Algorithms never sleep, ensuring no opportunities are missed in global markets
- **Backtesting Capabilities**: Test strategies on historical data before risking real money
- **Scalability**: Manage thousands of positions across multiple asset classes simultaneously
- **Consistency**: Execute the same strategy flawlessly regardless of market conditions or external pressures
- **Risk Control**: Automatically implement stop-losses and position sizing rules without hesitation
- **Pattern Recognition**: Identify subtle market patterns that humans might miss
- **Cost Reduction**: Lower transaction costs through optimal trade execution and reduced manual labor
| Aspect | Traditional Trading | Data Science Trading | Advantage |
|---|---|---|---|
| Decision Speed | Minutes to hours | Milliseconds | 10,000x faster |
| Data Processing | Limited human capacity | Unlimited computational power | Process vast datasets |
| Emotional Control | Subject to fear/greed | Completely objective | Better decision quality |
| Market Coverage | Limited by attention | Monitor thousands simultaneously | Never miss opportunities |
| Strategy Testing | Paper trading only | Extensive backtesting | Validate before deploying |
| Operating Hours | Business hours only | 24/7 global coverage | Continuous market presence |
| Cost Efficiency | High labor costs | Automated execution | Significantly lower costs |
| Consistency | Variable performance | Systematic approach | Reliable execution |
Risks, Limitations, and Ethical Concerns
Every powerful tool comes with potential pitfalls, and data science in trading is no exception. While the benefits are substantial, understanding the risks and limitations is crucial for anyone looking to implement these strategies. The most successful practitioners are those who respect these challenges and build safeguards to address them proactively.
Technical and Model-Related Risks
- **Model Overfitting**: Creating strategies that work perfectly on historical data but fail in live trading
- **Data Snooping**: Testing so many strategies that some appear profitable purely by chance
- **Regime Changes**: Market conditions change, making historical patterns irrelevant
- **Technology Failures**: System crashes, connectivity issues, or software bugs can cause massive losses
- **Flash Crashes**: Algorithmic trading can amplify market volatility during stressed conditions
- **Liquidity Risk**: Algorithms may struggle to execute trades during low-liquidity periods
- **Latency Issues**: Delays in data feeds or order execution can eliminate competitive advantages
Ethical and Market Fairness Issues
The rise of algorithmic trading raises important questions about market fairness and accessibility. High-frequency trading firms with superior technology and data access can profit at the expense of slower market participants. There are also concerns about market manipulation, where algorithms might be designed to create artificial price movements or exploit other traders' predictable behaviors. Regulatory bodies worldwide are grappling with how to maintain fair and orderly markets in an increasingly automated trading environment.
Best Practices for Risk Management
- **Robust Backtesting**: Use out-of-sample testing and walk-forward analysis to validate strategies
- **Diversification**: Avoid putting all capital into a single strategy or asset class
- **Regular Monitoring**: Continuously monitor algorithm performance and market conditions
- **Kill Switches**: Implement automatic stop mechanisms when losses exceed predetermined limits
- **Human Oversight**: Maintain human supervision and intervention capabilities
- **Gradual Deployment**: Start with small capital allocations and scale up gradually
- **Stress Testing**: Simulate algorithm performance under various market scenarios
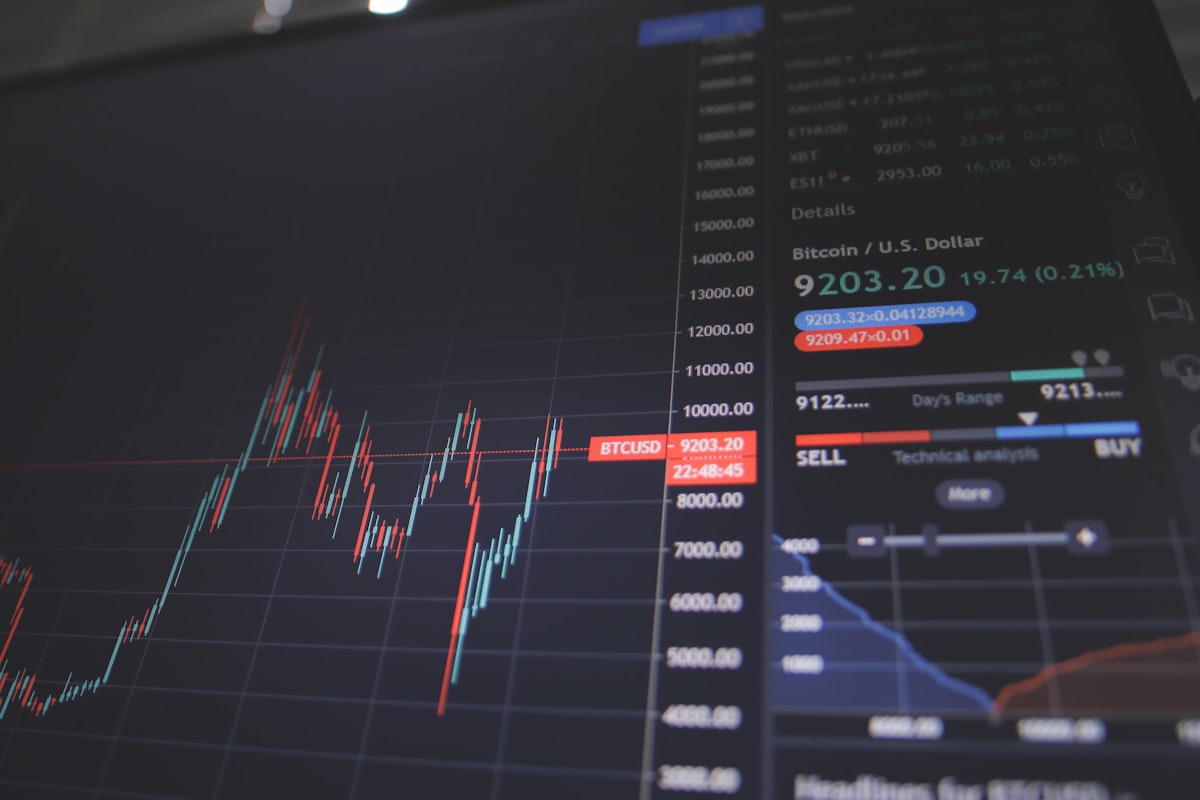
Effective risk management systems are essential for successful algorithmic trading
Learning Path: How to Get Started with Data Science for Trading
Breaking into the world of quantitative trading might seem daunting, but with the right learning path and resources, it's more accessible than ever. The key is building a solid foundation in both technical skills and financial knowledge, then gradually applying these skills to real market data. Here's a structured approach to mastering data science for trading, whether you're starting from scratch or looking to enhance existing skills.
Essential Foundation Skills
- **Mathematics and Statistics**: Probability, statistics, linear algebra, and calculus fundamentals
- **Programming**: Python or R for data analysis, with emphasis on pandas, NumPy, and visualization libraries
- **Financial Markets**: Understanding of stocks, bonds, derivatives, and how markets operate
- **Data Analysis**: Data cleaning, exploration, visualization, and basic machine learning concepts
- **Backtesting**: Learning to test trading strategies on historical data properly
- **Risk Management**: Understanding position sizing, diversification, and risk metrics
Top Learning Resources for Trading Data Science
QuantInsti EPAT Program
Comprehensive executive program in algorithmic trading covering Python, strategies, and risk management
Coursera Financial Engineering
Mathematical methods and computational finance from Columbia University
Python for Finance (O'Reilly)
Comprehensive book covering Python applications in financial analysis and algorithmic trading
QuantConnect Academy
Free algorithmic trading education with cloud-based backtesting platform
Udacity AI for Trading
Nanodegree program combining machine learning with quantitative trading
Khan Academy Statistics
Free foundational statistics and probability courses essential for trading
Zipline Documentation
Open-source algorithmic trading library with comprehensive documentation and examples
Hands-On Project Ideas
- **Moving Average Strategy**: Build and backtest a simple crossover strategy using Python
- **Sentiment Analysis**: Scrape financial news and analyze its impact on stock prices
- **Pairs Trading**: Identify and trade mean-reverting relationships between correlated stocks
- **Portfolio Optimization**: Use modern portfolio theory to build efficient portfolios
- **Volatility Prediction**: Forecast stock volatility using GARCH models
- **Options Pricing**: Implement Black-Scholes and other options pricing models
- **Market Regime Detection**: Use machine learning to identify different market conditions
- **Risk Management System**: Build a comprehensive risk monitoring and alerting system
Building Your Career in Quantitative Finance
The field of quantitative finance offers diverse career paths, from hedge fund quant researcher to fintech startup founder. Building a strong portfolio of projects, contributing to open-source trading libraries, and networking within the quantitative finance community are essential steps. Consider starting with internships or entry-level positions at prop trading firms, asset management companies, or financial technology companies to gain real-world experience.
Conclusion: The Future of Data-Driven Trading
The intersection of data science and trading continues to evolve at breakneck speed. Artificial intelligence is becoming more sophisticated, alternative data sources are proliferating, and computational power keeps growing exponentially. We're entering an era where quantum computing might revolutionize optimization problems, where satellite imagery predicts commodity prices, and where social media sentiment moves markets in real-time.
Perhaps most exciting is the democratization of these powerful tools. What once required millions of dollars in infrastructure and teams of PhDs is now accessible to individual traders with a laptop and an internet connection. Cloud computing platforms, open-source libraries, and educational resources have leveled the playing field in ways that were unimaginable just a decade ago.
The future belongs to those who can adapt to this data-driven landscape while maintaining the wisdom to know when human judgment should override algorithmic decisions. The most successful traders of tomorrow will be those who combine technical expertise with deep market understanding, statistical rigor with practical intuition, and cutting-edge technology with timeless risk management principles.
Ready to begin your journey into the exciting world of quantitative trading? Start building your foundation with our comprehensive data science and finance courses. Whether you're looking to enhance your trading skills or launch a new career in quantitative finance, the tools and knowledge you need are waiting for you. The markets never sleep, and neither does the opportunity to learn.
Tags:
Related Posts
Comments
Leave a Comment
No comments yet
Be the first to share your thoughts!